Deficient grades
The Deficient Grades report displays aggregated student performance by school, academic year and course ID during the previous four academic years. This report will display the percentage and number of students who have passed or received a deficient grade during the last 4 years in each A-G course contained in the TES data file.
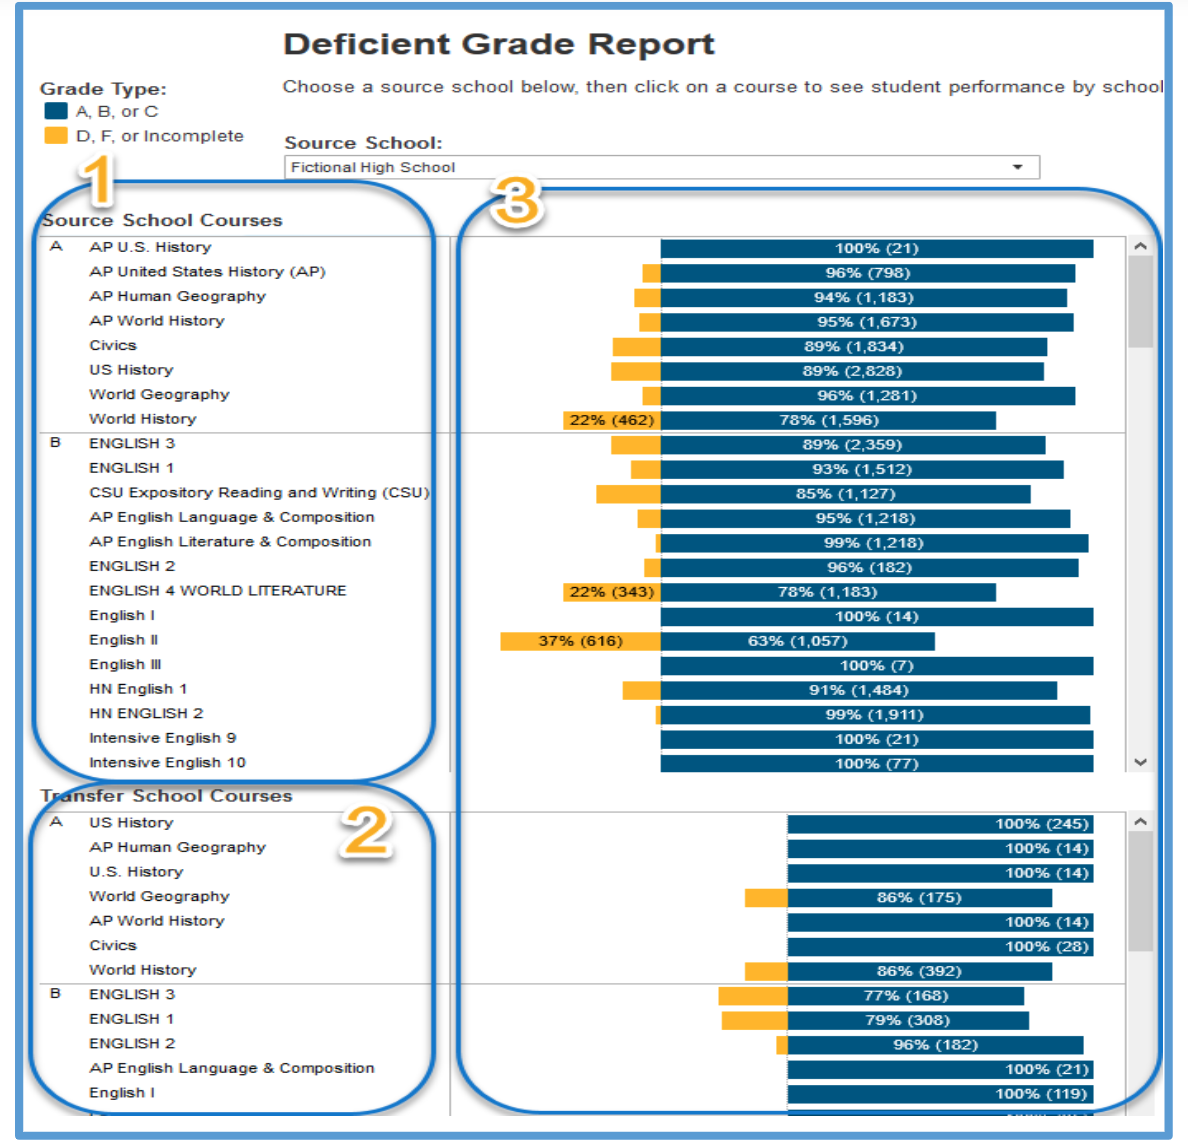
Here's a detailed look at a report.
This report:
- Displays all course titles submitted in the TES data file that have been verified as A-G approved and were taken by students at the evaluated school. Duplicate entries of course titles may result when multiple transcript abbreviations are submitted in the TES data file that correspond to the same course title.
- Displays all course titles submitted in the TES data file that have been verified as A-G approved and were taken by students at schools other than the evaluated school.These may include out of district or out of country schools. Duplicate entries of course titles may result when multiple transcript abbreviations are submitted in the TES data file that correspond to the same course title.
- Displays the total number and percentage of D’s and F’s received during the last 4 years in courses listed in #1 and #2 by students contained in TES data file. Courses taken by students in 9th and 10th grades will tend to have a higher number deficient grades because the total number of students in the data file who have taken those courses is larger (e.g. nearly all 9-12 graders will have taken an English 1 or English 9 course as opposed to an AP English Literature course that is only taken by 12th graders each year).
Want more information? Watch our overview video.